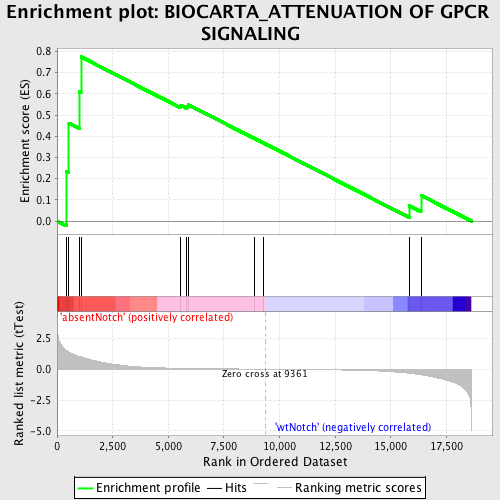
Profile of the Running ES Score & Positions of GeneSet Members on the Rank Ordered List
| Dataset | Set_03_absentNotch_versus_wtNotch.phenotype_absentNotch_versus_wtNotch.cls #absentNotch_versus_wtNotch.phenotype_absentNotch_versus_wtNotch.cls #absentNotch_versus_wtNotch_repos |
| Phenotype | phenotype_absentNotch_versus_wtNotch.cls#absentNotch_versus_wtNotch_repos |
| Upregulated in class | absentNotch |
| GeneSet | BIOCARTA_ATTENUATION OF GPCR SIGNALING |
| Enrichment Score (ES) | 0.7746875 |
| Normalized Enrichment Score (NES) | 1.4933289 |
| Nominal p-value | 0.038535647 |
| FDR q-value | 0.6884859 |
| FWER p-Value | 1.0 |
| PROBE | DESCRIPTION (from dataset) | GENE SYMBOL | GENE_TITLE | RANK IN GENE LIST | RANK METRIC SCORE | RUNNING ES | CORE ENRICHMENT | |
|---|---|---|---|---|---|---|---|---|
| 1 | GNB1 | 2120397 | 426 | 1.508 | 0.2331 | Yes | ||
| 2 | PRKAR1A | 3450369 | 532 | 1.376 | 0.4611 | Yes | ||
| 3 | PRKACB | 4210170 | 995 | 1.021 | 0.6096 | Yes | ||
| 4 | GNAS | 630441 1850373 4050152 | 1074 | 0.997 | 0.7747 | Yes | ||
| 5 | PRKAR1B | 6130411 | 5550 | 0.072 | 0.5464 | No | ||
| 6 | GNGT1 | 5220156 | 5821 | 0.064 | 0.5427 | No | ||
| 7 | PRKAR2A | 2340136 | 5916 | 0.061 | 0.5480 | No | ||
| 8 | GRK4 | 3840347 5340113 | 8870 | 0.007 | 0.3904 | No | ||
| 9 | PRKAR2B | 3130593 5220577 | 9292 | 0.001 | 0.3680 | No | ||
| 10 | ARRB1 | 2650670 2690195 4920592 6660121 | 15836 | -0.328 | 0.0719 | No | ||
| 11 | PRKCA | 6400551 | 16357 | -0.456 | 0.1214 | No |

